Apache Unomi Google Data Studio Connector
This connector can be used to connect to your Dropsolid Experience Cloud managed Apache Unomi. It allows marketeers to view in-depth info about the profiles and their events from the CDP via reports made in Google Data Studio.
Contact support
For any problems with the connector please contact Dropsolid Support via the contact mail.
How to use
If you want to use the connector to view in-depth info about profiles and events of your CDP, you can follow the instructions in the README page of the following template created by the developer. Profiles and Events Report Template README
Or follow the more extensive instructions on this support page. How to setup a Datastudio CDP Datasource
Note: You can use the given template already provided by the developer. How to copy the Dropsolid template
Tutorials: How Datastudio reports work
If you have successfully created the datasources based on the chosen CDP, you can watch the following tutorial that explains how to create your own reports. Google Data Studio Reports and Dashboard Tutorial
The next video explains how to best use the visualisation charts. Google Data Studio Data Visualisation Best Practices
Setup a Datastudio CDP Datasource
step 1: Make a copy of the data source (click the link below):
Unomi Profiles/Events datasource
and click on the "Make a Copy" button just left of the "Create Report" button.

Step 2: Click on "Copy Data Source" to create a copy in a new tab.
Step 3: Change the data source name in the top left corner from "Copy of ..." to something appropriate.
Step 4: If you don't see an authorisation screen, click on the "Edit Connection" button, which will take you to the configuration Window.
Step 5: Click the "AUTHORISE" button and authorise with your Google Account. Please click "Allow" where the Dropsolid connector wants to access your Google Account.

Step 6: When Authorised with your Google Account, you'll need to authorise with a Dropsolid Platform account. Click the "AUTHORISE" button and authorise with your Dropsolid Platform Account.

Step 7: In the parameters pannel (configuration pannel), select the appropriate project that you have access to. This would be the project you're working on.

Step 8: Next choose the correct datatype you want to work with (Profiles or Events).

Step 9: The "dashboard url for events" is used for a personalised events dashboard for each profile. You can leave this empty for now, but if you make your own events dashboard or use the one from the template you can insert the link of the report page here. You can find instructions on how to do this below. IMPORTANT: Only for the Profiles datasource, ignore this parameter for the Events Datasource

Step 10: If you want to only get a certain amount of data back, you can use the Row Limit parameter. Leaving this empty or setting this to -1 will fetch all data. Leave the Profile ID parameter empty (this is used for personalised events by profiles when there is an events page present).


Step 11: Please check the checkboxes depending on what datasource you are working with (see figure below) of the events url, row limit and profile id that allows parameters to be modified in the report.

Step 12: Click "Reconnect".

Step 13: Review the confirmation, which should say "Allow parameter sharing?", and click "Allow".
Step 14: Review the confirmation and click "Apply".
Step 15: You are now set to create reports with this new datasource.
Copy the Dropsolid template
Step 1: Open the Link of the report: Report
Step 2: Make a copy of this report by clicking the "Make a copy" button at the top right of your screen, as shown below.

Step 3: Point the "New Data Source" to the newly created data sources from the above steps, and click "Copy Report".

Step 4: Change the report name in the top left corner from "Copy of ..." to something appropriate.
Step 5: You are now ready to use the template as your own, adding charts, customising the report to your desires...
Using the custom profile based events dashboard field
If you want to create an events dashboard based on one profile, you can use the configuration parameter Dashboard url for events. First you'll want to create a custom events page with the events datasource or if you use the provided template you can use the already created events page in the report.
Setting this parameter is done in the configuration part of the datasource.
Follow the next instructions to set the url. (Only if you have an events dashboard present)
Step 1: Make sure you are on the Events page and go to "File" and click "Embed report"
Step 2: Make sure the "Enable Embedding" box is checked, Click the "Embed url" option and press "COPY TO CLIPBOARD"
Step 3: Go to "Resource" in the header and click "Manage added data sources".
Step 4: Click "Edit" on the Profiles data source.
Step 5: Click "Edit Connection" on the top left of the page.
Step 6: Paste the copied link in the input field of the Dashboard url for Events parameter.
Step 7: Now click "RECONNECT" on the top right hand side of the page.
Step 8: Go to "Resource" in the header and click "Manage report URL parameters". Here make sure the Profile ID parameter is set as followed: (The Profile Id Parameter from the Events datasource)

note: It is important to name the parameter ds0.profileId
You should now be set to use the "Events Dashboard" field from the Profiles Data source.
Possible problems
After changing the configuration the report won't load
This can be fixed by just reloading the page. If not contact support.
Geological, number, date... Field Types might be set to "TEXT", this causes some charts to have an issue
This can be fixed by editing the field type in the datasource. This is done as followed:
Step 1: Go to the Resource tab in the menu bar and click "manage added data sources"
Step 2: Click "EDIT" on the datasource that's providing you with problems
Step 3: Find the field which is giving you problems. (You can find the field by typing it in the search-bar at the top-right)
Step 4: Select the field type and change it to the desired field type. (See example below, Country Name (text) --> Country Name (Country))

Step 5: Click "Finished" and the field should be updated.
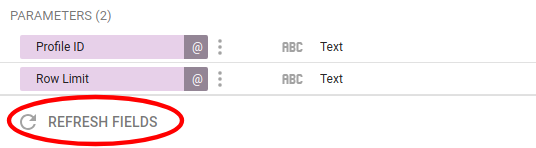
After adding a new capture property to your site, this property isn't available in the data source
Step 1: Go to the Resource tab in the menu bar and click "manage added data sources"
Step 2: Click "EDIT" on the datasource that's providing you with this problem
Step 3: Click on the "REFRESH FIELDS" button on the bottom of the page
This will refresh the fields and then show you all the new and/or deleted fields
Shared dashboard shows no data when viewed by someone else
When sharing a dashboard it may be possible that after a day or two the people viewing the dashboard will see this:
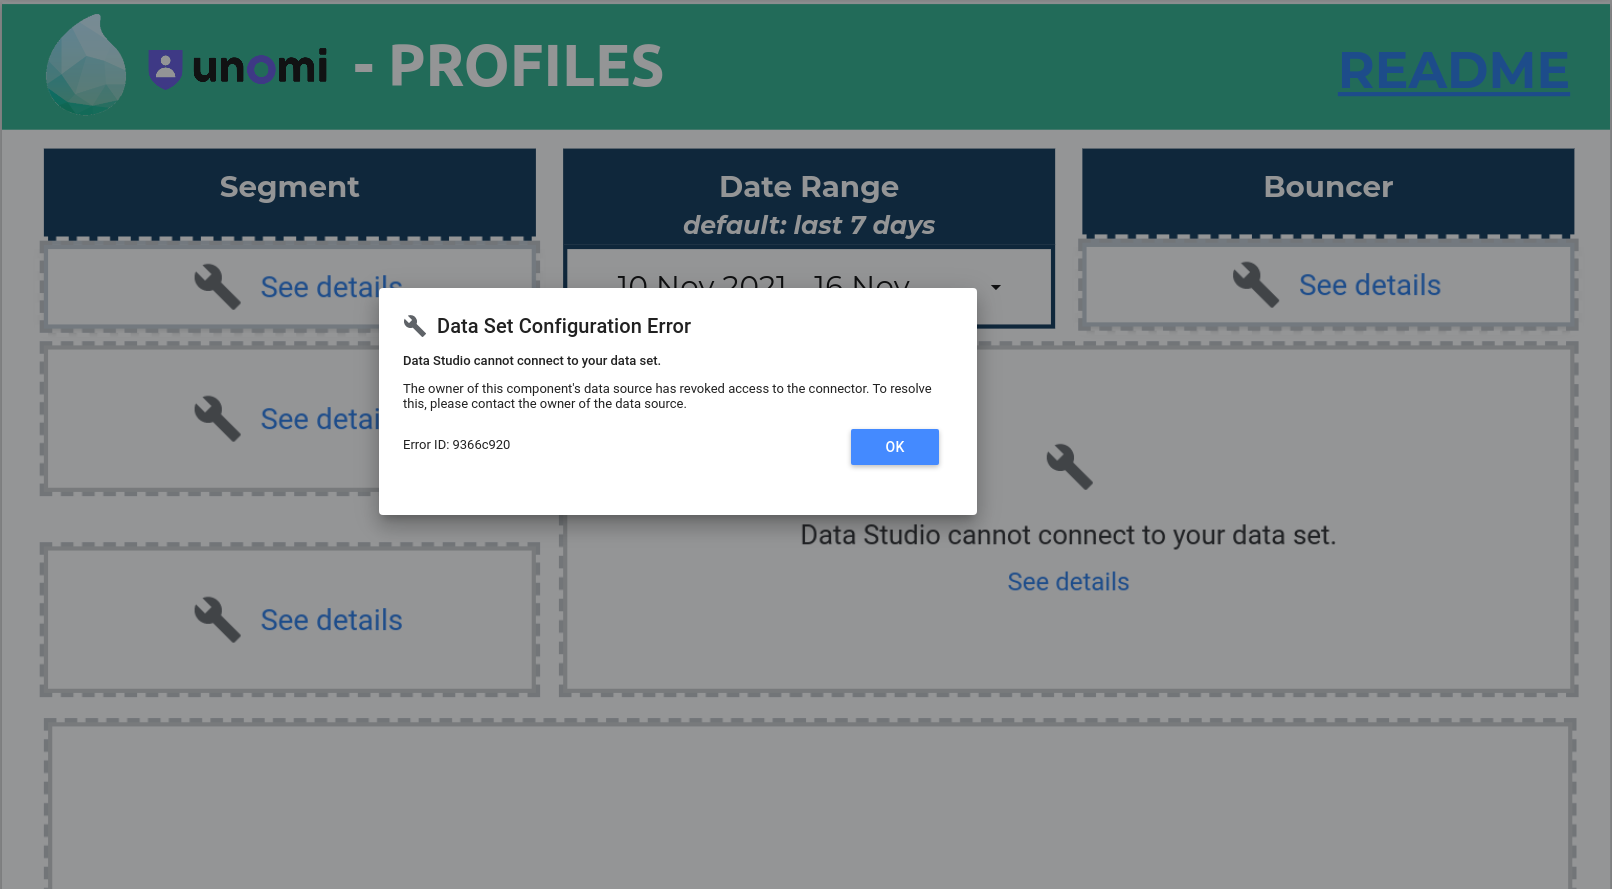
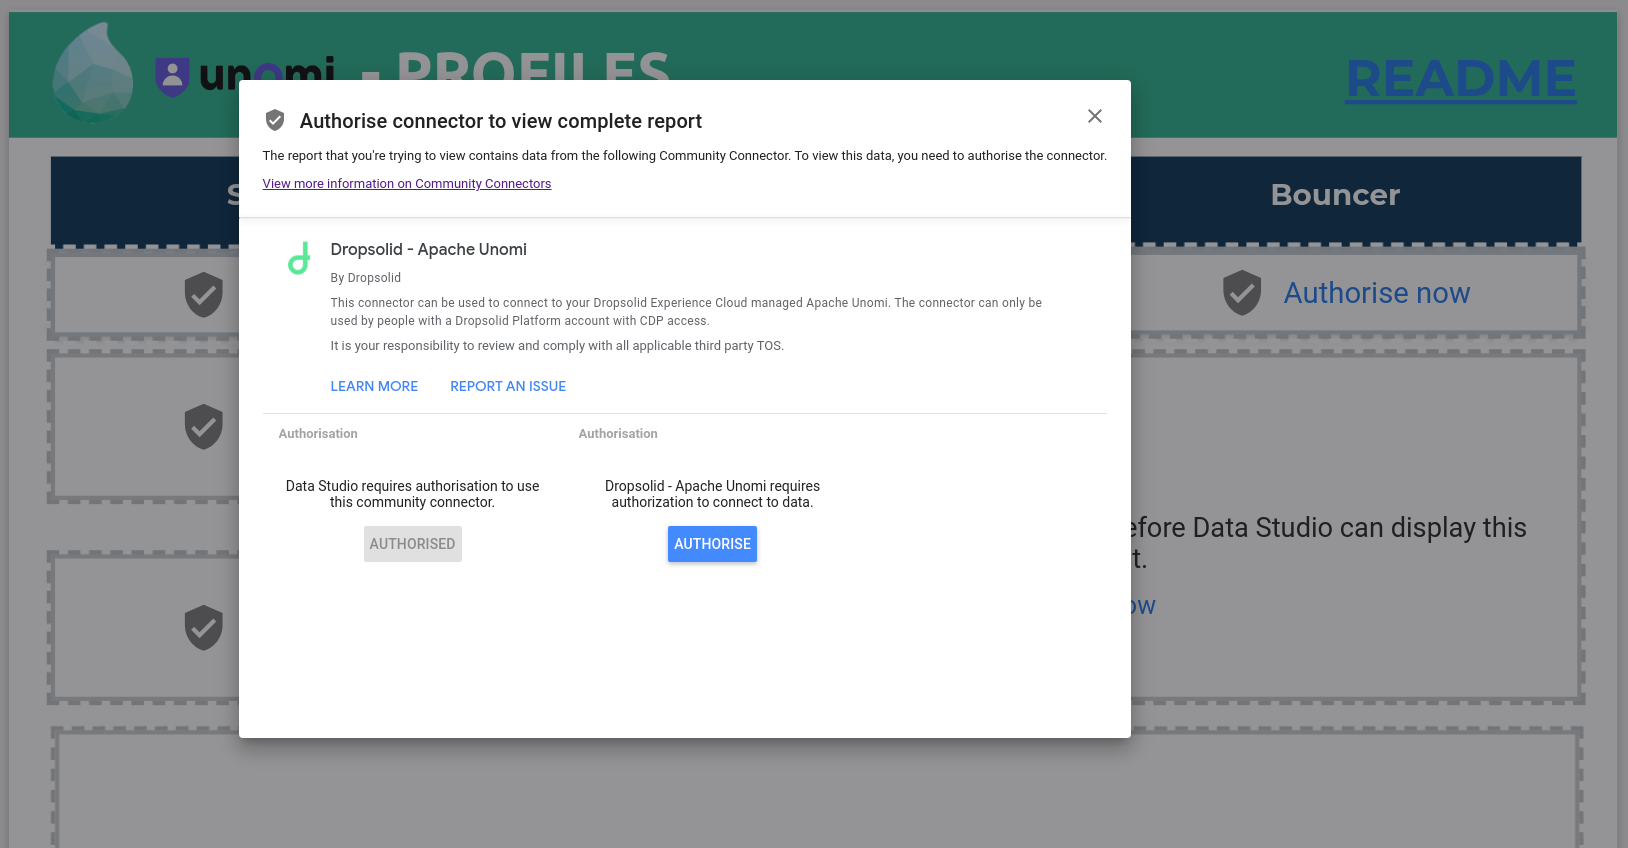
The reason you might see this is that the data credentials are set on "owner" by default in the data source of the dashboard. The access token of the owner of the dashboard has expired. You as the viewer can't solve this issue, so the owner needs to reauthorize with platform again.
When the owner has reauthorized by going to the dashboard and authorizing, the viewer will be able to see the data again.
' fill='%235BE798'/%3E%3Crect x='16' y='250' width='16' height='140' transform='rotate(-180 16 250)' fill='%235BE798'/%3E%3Crect x='16' y='250' width='16' height='140' transform='rotate(-180 16 250)' fill='%235BE798'/%3E%3Crect x='91' y='16' width='16' height='283' transform='rotate(-90 91 16)' fill='%235BE798'/%3E%3Crect x='91' y='16' width='16' height='283' transform='rotate(-90 91 16)' fill='%235BE798'/%3E%3Crect x='91' y='16' width='16' height='283' transform='rotate(-90 91 16)' fill='%235BE798'/%3E%3C/svg%3E)