Overview
In this topic we will describe how you can check if personalisation is working on your site.
The examples below are all in Google Chrome. If you are using a different browser then it may look a bit different, but the info shown is still the same.
Make sure you have configured your cdp settings and added the capture snippet to your site.
-
Open your site in your browser.
-
Open the developer tools. This can be done with
F12or by right-clicking and choosingInspect. -
Go to the
Networktab of the developer tools and there toFetch/XHR.

-
Filter on the term
personalisation. -
Now everytime a data capture happens you will see these in this window. You can easily trigger a capture by just clicking somewhere on the site. The captures have the name
personalisation-cdp-{cdp_uuid}.

-
By clicking on one, you can open this data capture to see more info.
-
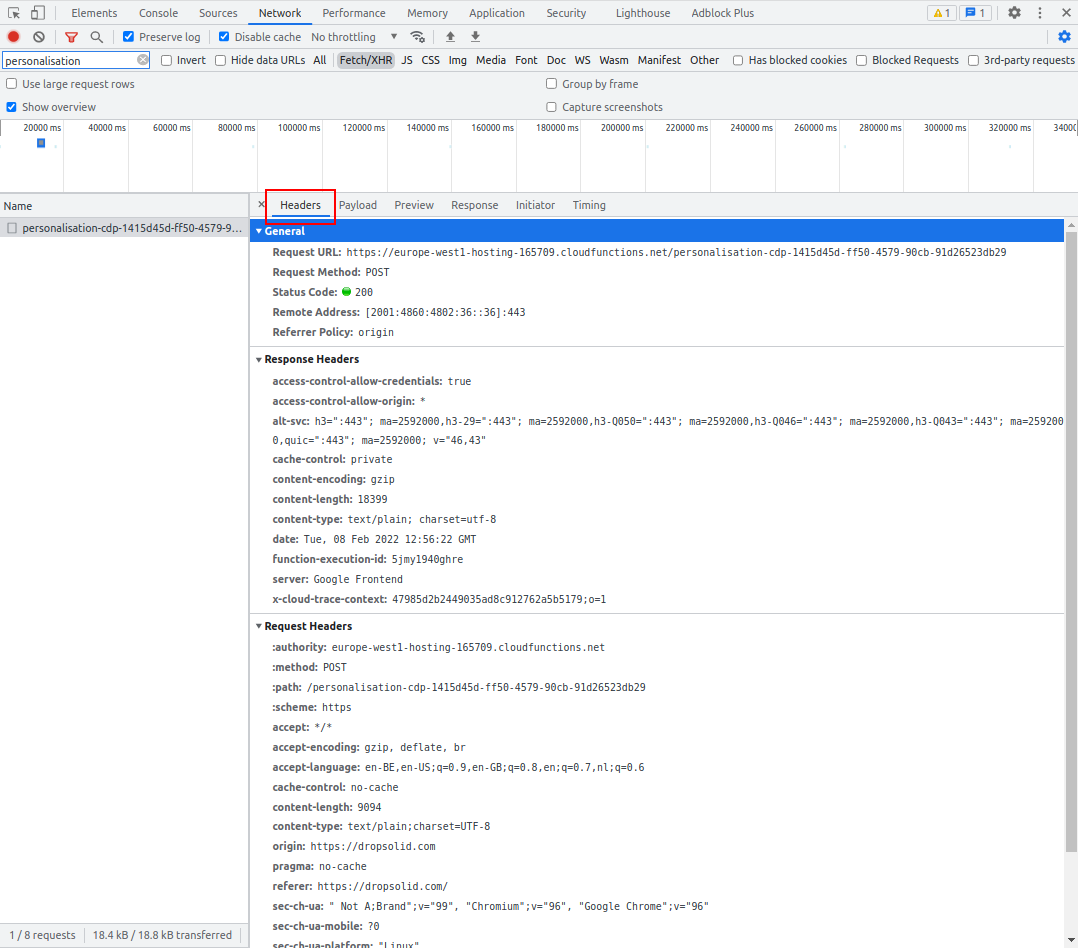
In the
Headerstab you can see more info about the API call being made.
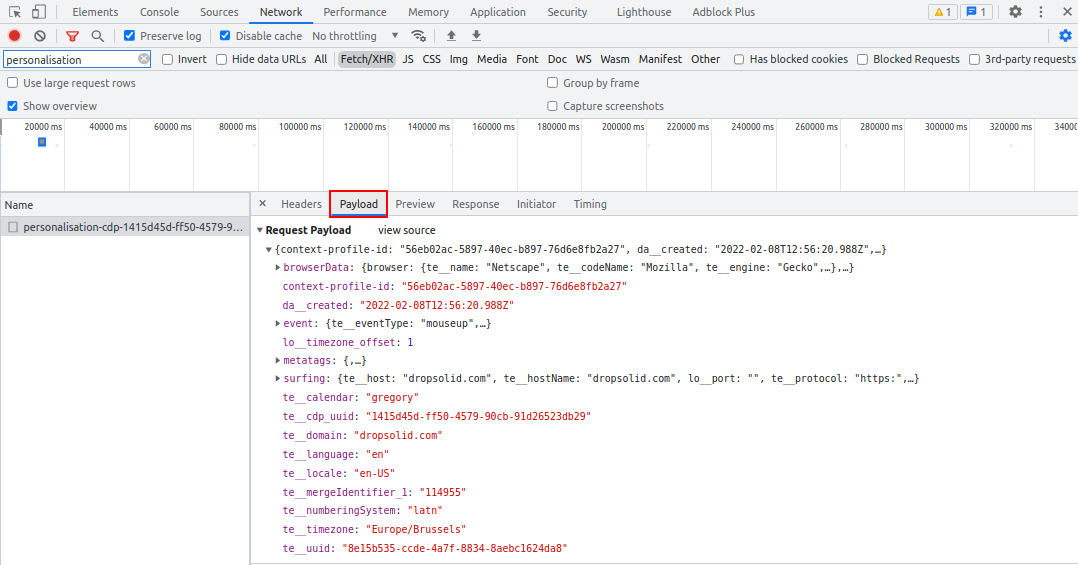
- In the
Payloadtab you can see the request body of the API call. This is all the data the capture sends to the API.
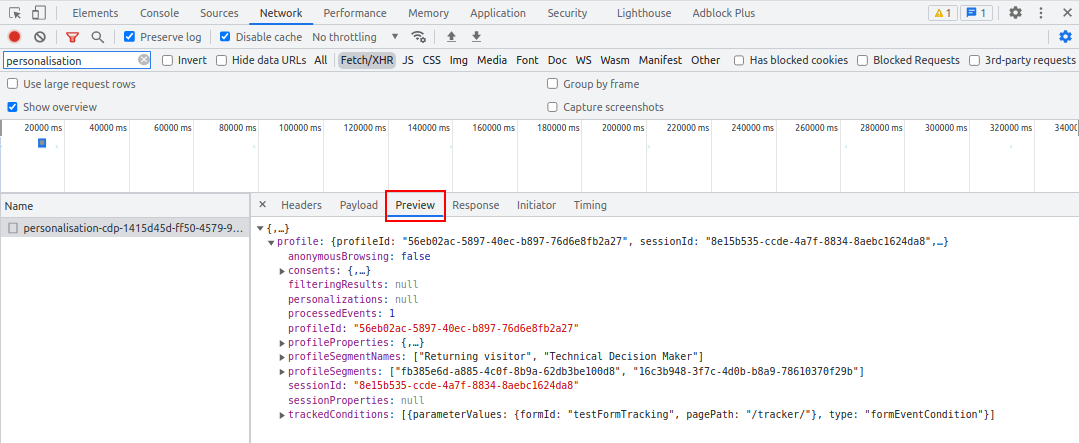
- In the
Previewtab you can see a formatted version of the response of the API call. This is the Unomi profile of the visitor.- In the
profilePropertiesproperty you can find all the properties that you can use to create a segment. - In the
profileSegmentNamesproperty you can see which Unomi segments this visitor is a part of.
- In the
- In the
Responsetab you can see a plain text version of the response of the API call. We recommend looking at thePreviewtab instead since that contains the same data but is easier to read.

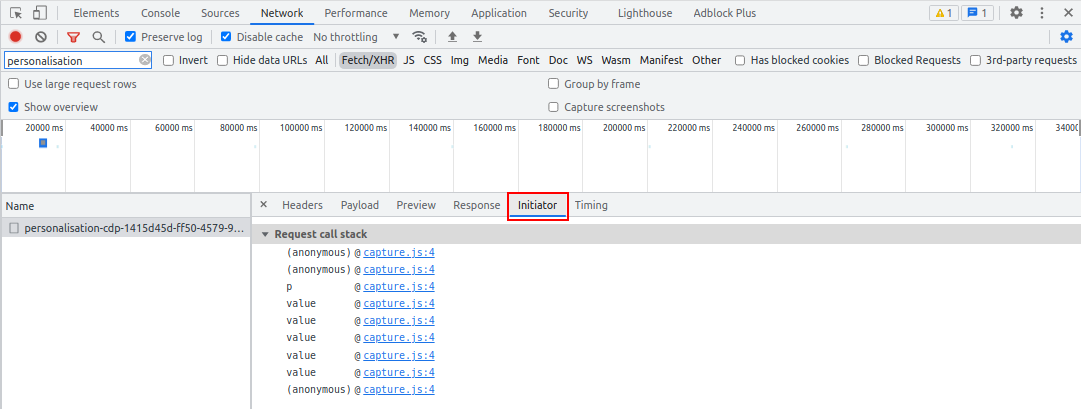
- In the
Initiatortab you can see which script created the API call. In our case this is the capture script.
- In the
Timingtab you can see the timing breakdown of the request. More information can be found here.
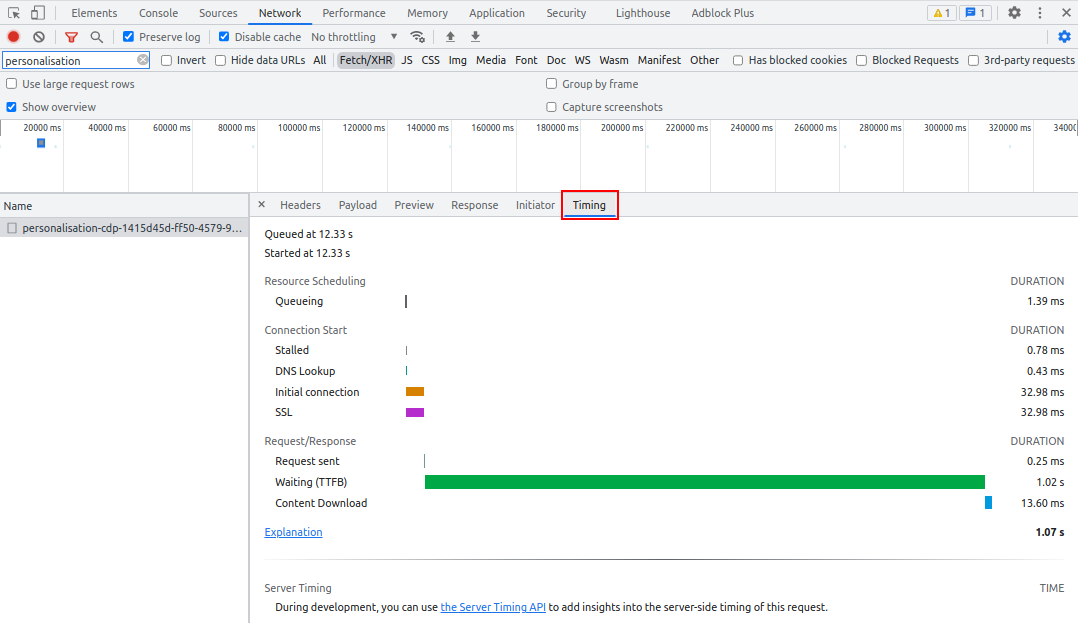
By using these different tabs you can check what is being sent to the API and which response Unomi returns. This way you can test if the correct data is getting in Unomi if you for example have added a scoring property or other custom data.
